Semrush Local integrates with Google Business Profile (GBP) to give you direct access to performance data from Google Search and Google Maps.
Here are the key insights you get:
- Local search visibility: How often your business appears in search results and on Maps
- Device breakdown: Separate data for desktop and mobile users
- Historical performance: Over 24 months of data (4x more than Google's standard report). You can analyze the performance by day, week, or month. Or compare year-over-year data to spot trends.
- Engagement metrics: Website visits, direction requests, phone calls, and when these interactions occur throughout the week
Why Use Semrush Local for GBP Insights?
Semrush Local gives you more historical data, customizable reporting, and deeper performance insights than Google's standard GBP dashboard. Use this extended data to track your local business’ growth over time.
Understand Your GBP Insights Data
The GBP Insights report displays several key metrics that show how customers discover and interact with your business listing. Let's break down each one.
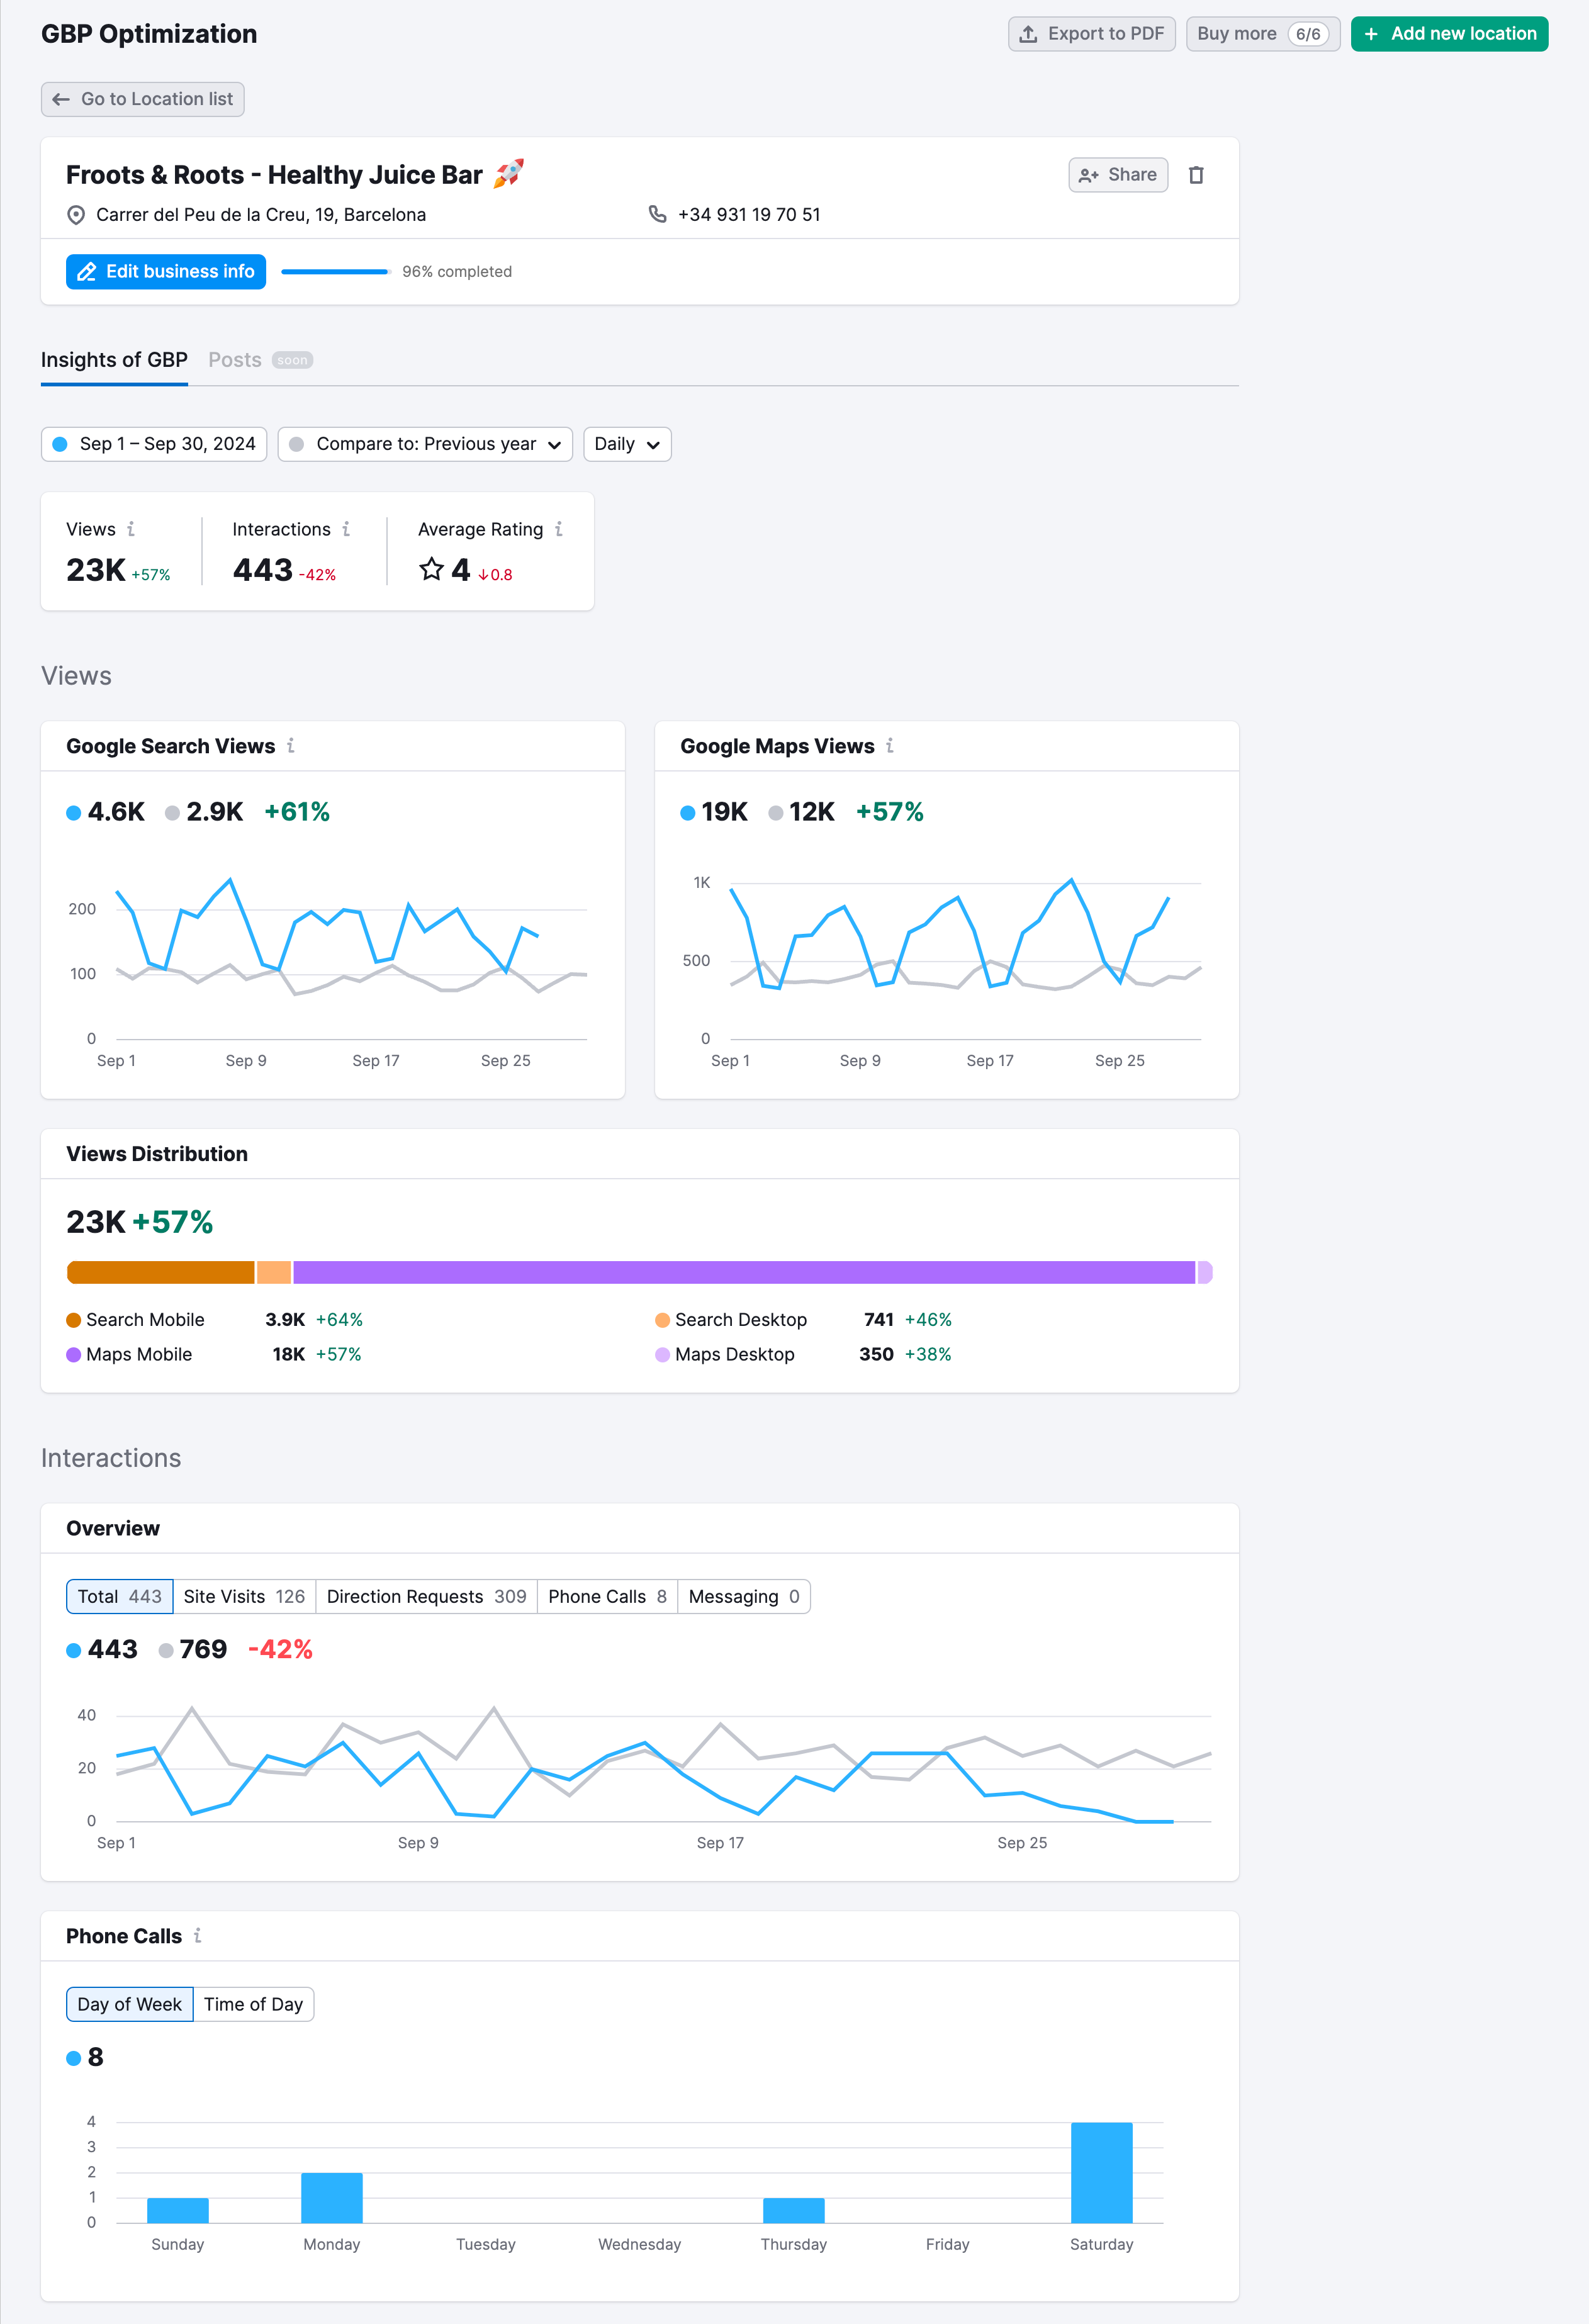
1. Top Metrics Overview
At the top of the report, you'll see three primary metrics:
- Views: Show how many times your business listing appeared to users across Google Search and Google Maps during the selected time period. The number includes both search results views and map views.
- Interactions: Count how many times users took action on your listing—visiting your website, requesting directions, or calling your business. This metric effectively measures user engagement
- Average Rating: Your business's average star rating from customer reviews
2. Views Breakdown
This section separates views into two sources and shows trends over time.
- Google Search Views: Shows how many times your listing appeared in Google Search results (not Maps). The graph shows daily fluctuations, helping you spot patterns like weekday vs. weekend performance.
- Google Maps Views: Shows how many times your listing appeared in Google Maps.
3. Views Distribution
This widget breaks down your total views by device type and source, showing where your visibility comes from.
4. Interactions Overview
This section shows how users interacted with your listing. Users could interact by
- Clicking on your website
- Requesting directions
- Making a phone call
- Sending a message through GBP
The graph shows daily interaction trends. This helps you identify which days generate the most engagement—useful for staffing decisions.
5. Phone Calls
This widget shows when customers call your business throughout the week.
You can toggle between:
- Day of Week: See which days you get the most calls
- Time of Day: See what times customers typically call
This data helps you:
- Staff appropriately on high-call days
- Adjust business hours if you're missing calls
- Time promotions for when customers are most likely to call